Newsletter
Stay up to-date with the latest imaging, analysis and metrology news from Digital Surf.


The new Mountains® 10.2 version release is just around the corner with a number of new features, in particular dedicated to users working with topographic data. Read on to find out more.
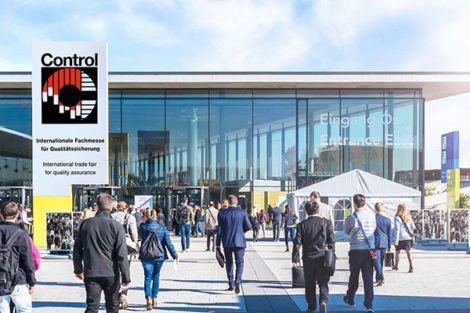
The 36th Control trade fair will take place in Stuttgart from April 23 to 26. We would be pleased to welcome you to our booth #1512!
Our main focus is on working as a partner with instrument manufacturers worldwide, in the fields of surface metrology and microscopy. Mountains® software is now offered by the majority of profilometer and microscope manufacturers and is embedded in their equipment or available as an option.
Digital Surf also provides Mountains® software packages directly to instrument users. Mountains® has an installed base of 22,000+ licenses worldwide, is available in 11 languages, supports ISO and national metrology standards and is supplied by 50+ instrument manufacturers.
Application areas include: automotive, materials science, semiconductors, medical, aerospace, MEMS, renewable energy, etc.
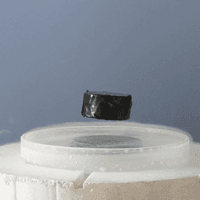
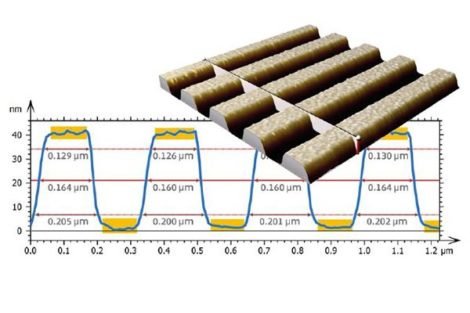
Researchers at the Institut de Ciència de Materials de Barcelona characterizied surface texture of superconductor materials with the aim of improving their performance.
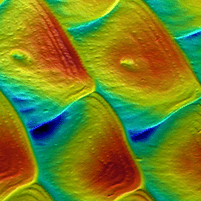
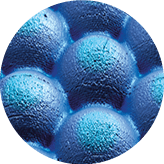
Researchers at Purdue and Harvard universities explored fish scale surfaces in 3D using MountainsMap® software.

Dive into our free online surface metrology guide and learn how to characterize surface texture in 2D and 3D using the right parameters and filters
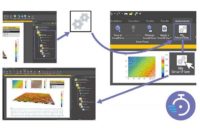
Enter Mountains® surface and image analysis software no-code automation tools. Isabelle Cauwet, support and applications specialist, delves into how these software tools can boost your productivity.